1. Executive Summary
Chilika Lake, Asia's largest brackish water lagoon and a vital Ramsar site, is a complex socio-ecological system facing challenges from sedimentation, varying salinity, and intense aquaculture expansion. To preserve its rich biodiversity—including the endangered Irrawaddy dolphins—and manage the socio-economic dynamics between traditional fisherfolk and aquaculture farmers, a modern, data-driven approach is essential.
This proposal outlines a strategic technological intervention utilizing Artificial Intelligence (AI) and 3D visualization. By unifying decades of ecological data and creating predictive simulations, we aim to empower the Chilika Development Authority (CDA) and IUCN India to make proactive, sustainable decisions while fostering immersive ecotourism experiences.
2. Client & Project Overview
The Subject
Chilika Lake supports the livelihoods of nearly 0.14 million fishers and is a crucial buffer against floods and cyclones on the East Coast of India. The ecosystem's delicate balance is maintained through a combination of marine brackish water and freshwater.
Client Inputs & Data Baseline
Based on the comprehensive documentation provided by IUCN, the following baseline factors shape our approach:
- Historical & Biodiversity Data: Extensive records of 317 fish species, diverse phytoplankton, and crucial waterfowl congregations.
- Socio-Economic Factors: The rise of culture-based fisheries (aquaculture) leading to conflicts and ecological degradation due to unmanaged enclosures (gheris).
- Environmental Metrics: Fluctuating salinity levels, sedimentation rates from the Mahanadi delta, and the impacts of the historic artificial mouth opening in September 2000.
3. Proposed Solutions
We propose a four-pillar technological architecture designed to translate raw data into actionable governance and public engagement tools.
Custom AI Query & Inference Engine
Features: A Natural Language Processing (NLP) engine capable of parsing decades of scientific journals, legal rulings, and socio-economic surveys. It includes a web portal for officials and multi-lingual public kiosks.
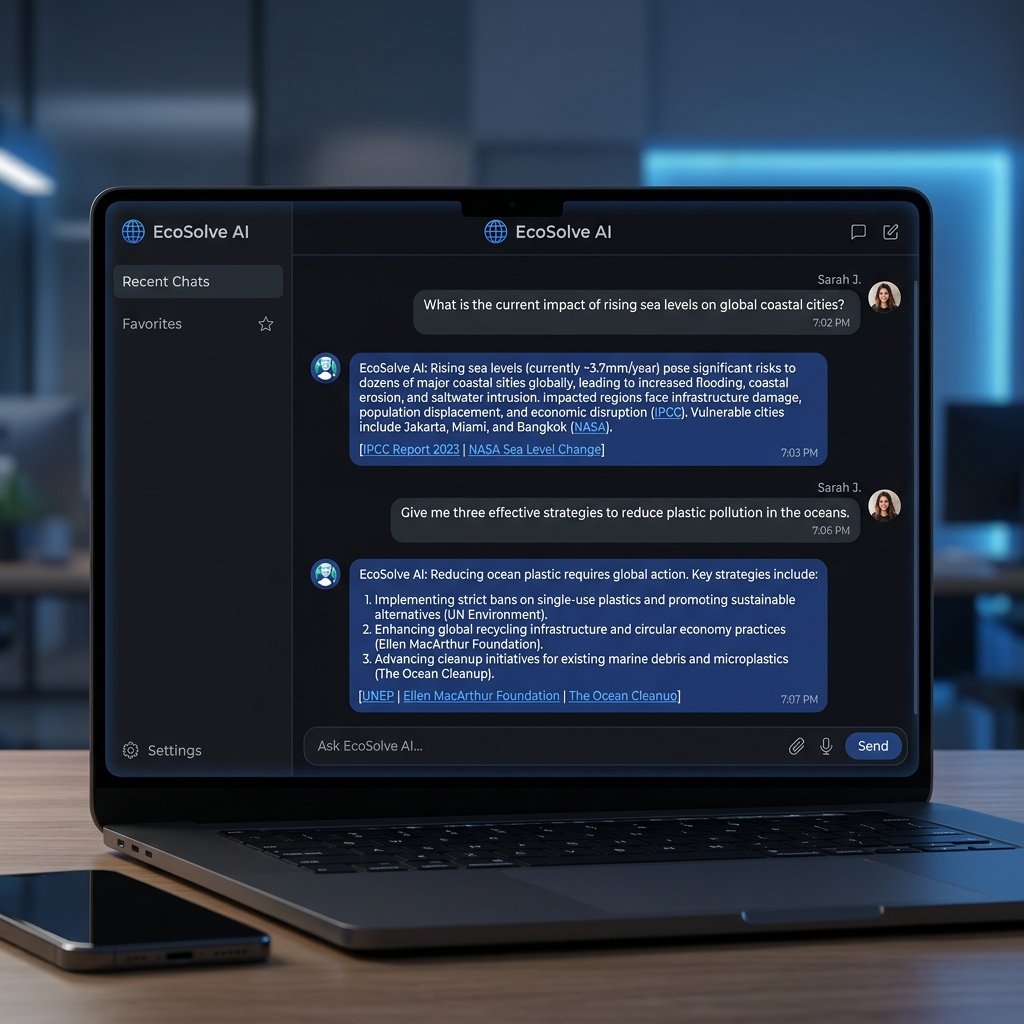
Fig 1: AI Chat Interface displaying source-cited answers to environmental queries.
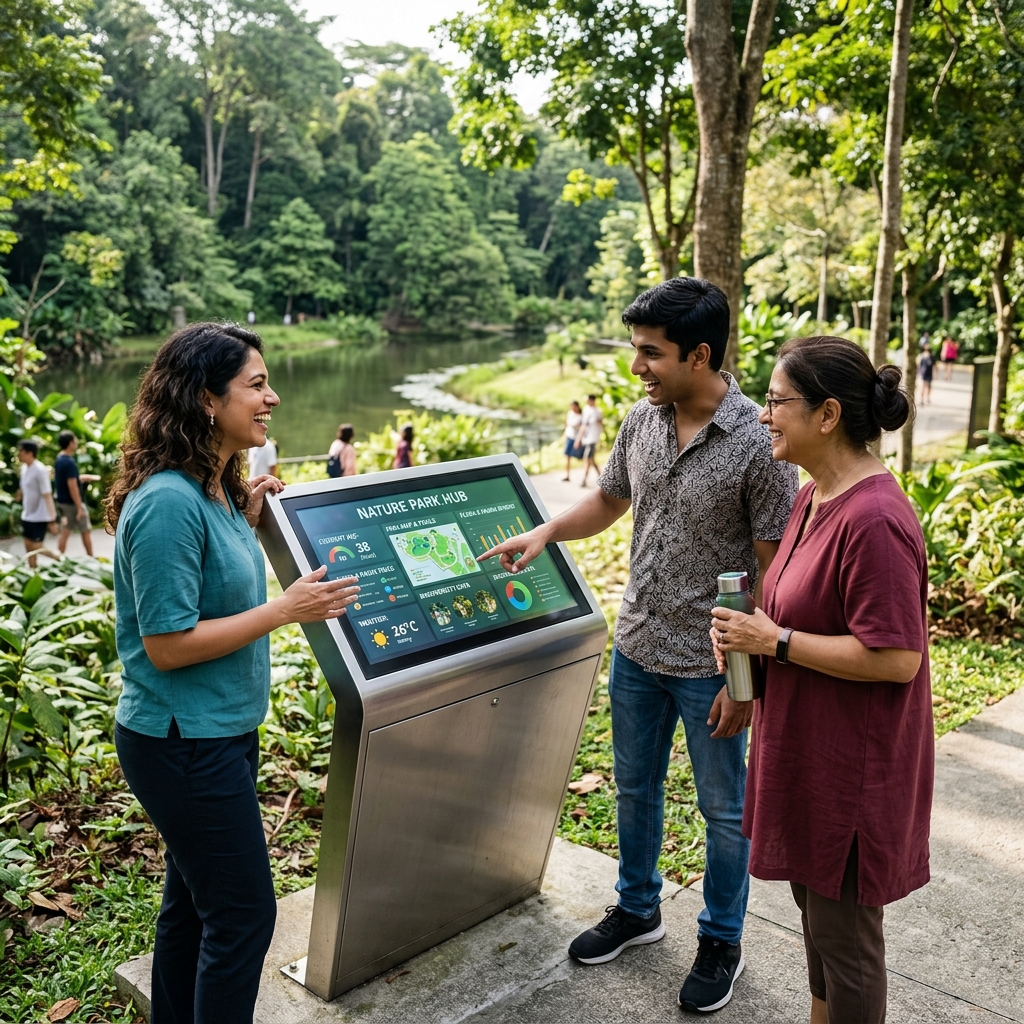
Fig 2: Conceptual render of public ecotourism kiosks deployed around the lake.
Unified Analytics Dashboard
Features: Real-time aggregation of multi-source datasets including terrain, vegetation mapping, water quality (salinity, pH), and fish landing statistics. Generates public-facing charts.
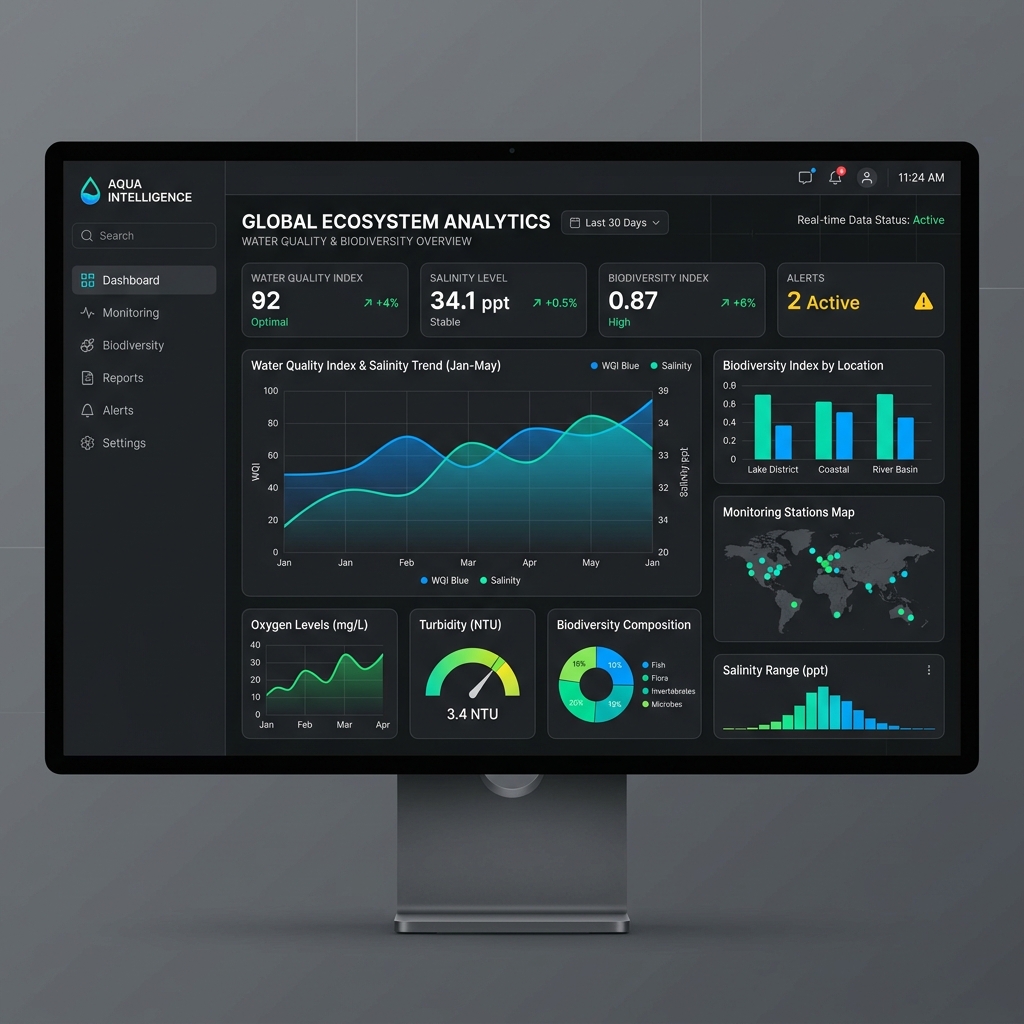
Fig 3: Sophisticated environmental analytics dashboard.
AI-Powered Simulation & Planning
Features: Predictive modeling utilizing historical data on natural and human-driven factors to forecast future ecological states.
Usage & Example: Before initiating major physical changes, the engine can simulate outcomes. For example, using the historic September 2000 artificial mouth opening at Satapada as a reference point, the AI can simulate how further dredging or new channel creations will impact salinity gradients and the migration patterns of Irrawaddy dolphins.
3D Map Showcase (VR/AR)
Features: A high-fidelity 3D map rendering the terrain using accurate altitude levels, overlaid with programmable vegetation, drone footage, and visual layers representing salinity or microclimate variations.
Usage: Accessible via web browsers or VR headsets at visitor centers, allowing users to "fly" over the lake and observe Spatio-temporal variations and habitat suitability mapping.
4. Value Proposition & Next Steps
The implementation of these technologies ensures the long-term sustainability of Chilika Lake by replacing fragmented management with data-driven, proactive governance.
Development Plan & Next Steps
1. Discussion & Data Assessment: A collaborative session to determine data readiness, security requirements (e.g., self-hosting AI models vs. cloud), and priority of solutions.
2. Fast MVP (Minimum Viable Product): Rapid deployment of the 3D Map Showcase and a foundational version of the Analytics Dashboard to provide immediate value and demonstrate capabilities.
3. Incremental Rollout: Phased integration of the Custom AI Query Engine and predictive Simulation modules as data pipelines are solidified.
5. Project Team & Communication
Your dedicated points of contact for the duration of this project implementation.