Xynocast · Technology & Conservation← Back to full proposal
XynocastTechnology & Conservation
Proposal forIUCN

Chilika Lake Ecosystem
Technology Solutions

Leveraging AI and 3D visualisation for conservation & governance

PREPARED FORIUCN India
Chilika Lake Project
PREPARED BYXynocast Consultancy Services
DATEJune 23, 2026
REFERENCEInteractive 3D Map Showcase

The Challenge

Asia's largest brackish lagoon, under pressure

A Ramsar site, a working fishery, and a buffer against floods and cyclones on India's east coast — held in a delicate balance.

  • Sedimentation from the Mahanadi delta is reshaping the lagoon.
  • Salinity swings from 0.13 to 36 ppt across the year and across sectors, altering habitat suitability.
  • Aquaculture expansion — unmanaged enclosures (gheris) drive degradation and conflict with traditional fisherfolk.
  • Endangered species, notably the Irrawaddy dolphin, depend on this balance holding.
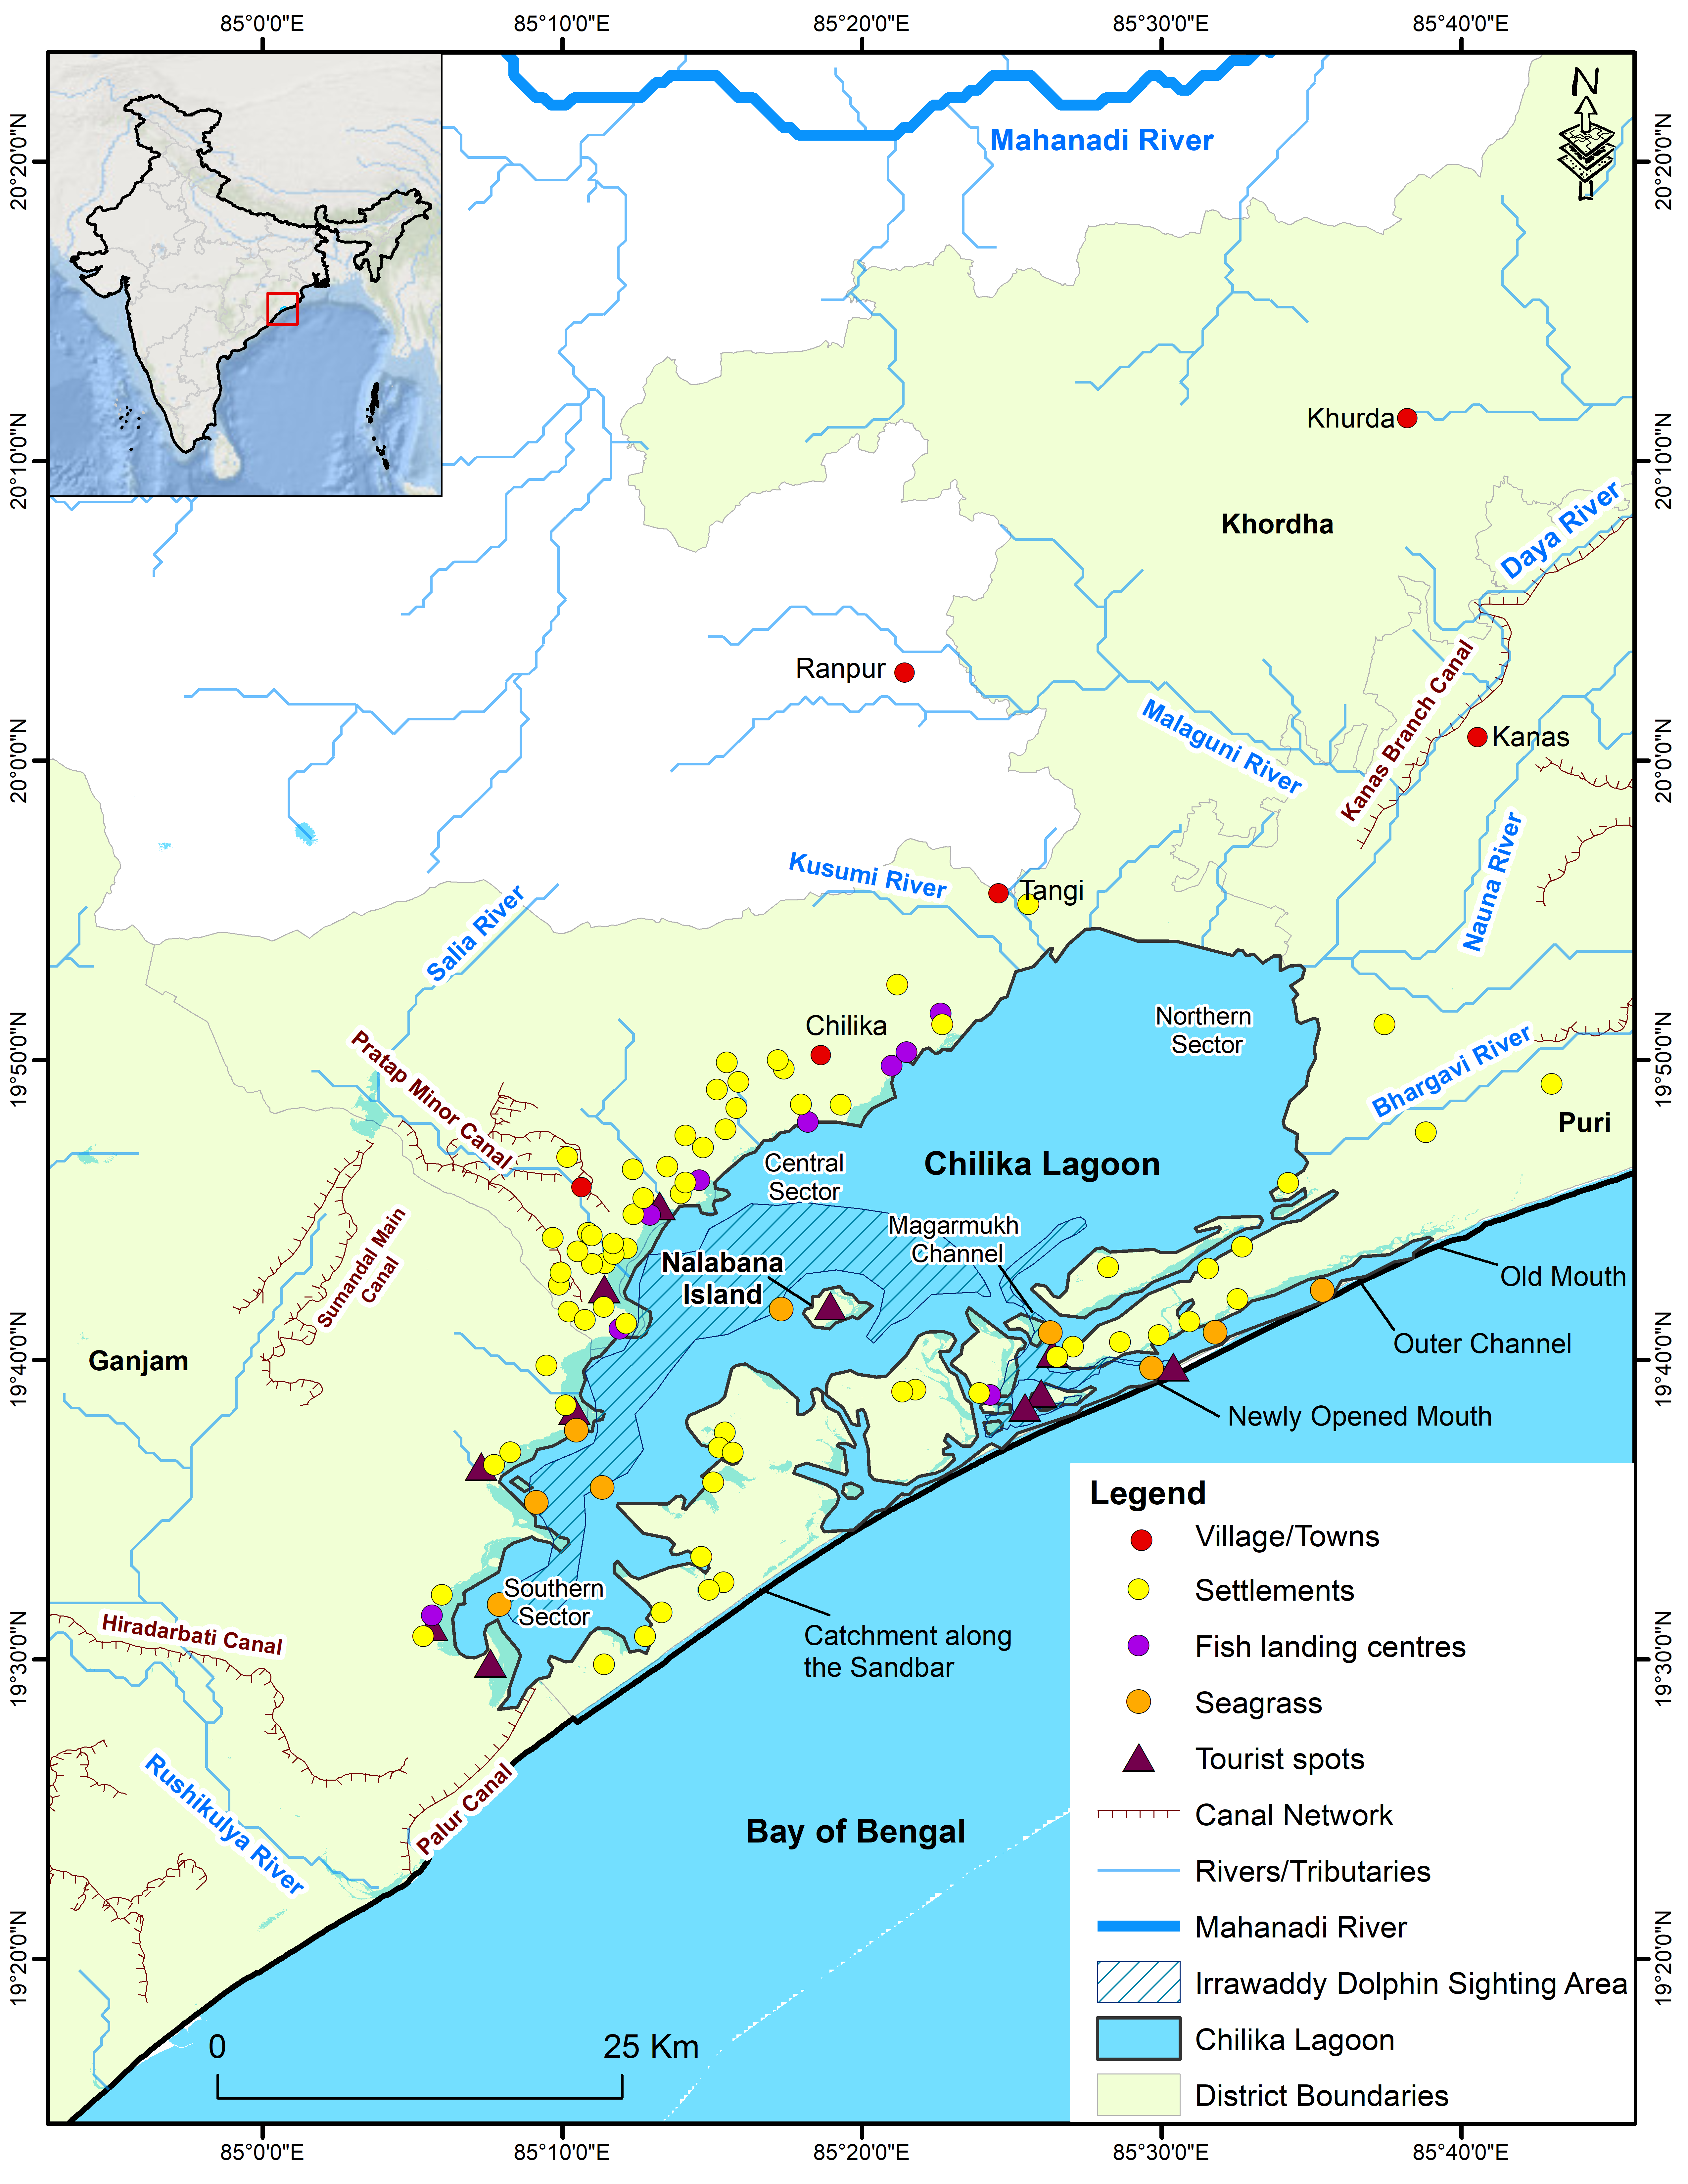
Map of Chilika Lagoon showing its four sectors, the Irrawaddy dolphin sighting area, fish landing centres, seagrass beds and the old and newly opened mouths
Four sectors, 1,165 km². Dolphin habitat, seagrass beds and fish landing centres sit within a single hydrological system.

Client Inputs

Decades of data, waiting to be joined up

The gap is not data collection — it is unification, access and interpretation.

1,165 km²
Lagoon area, 64 km long
317
Fish species on the post-restoration checklist — 77 newly recorded
726
Flowering plant species, 496 genera
0.14 M
Fishers whose livelihood depends on the lake
12,465 MT
Average annual fish landing (2011–15)
8,660 ha
Seagrass — ₹498–828 M/yr in blue carbon
The opportunity: this record already proves intervention works. Unified and made queryable, it becomes the evidence base for the next decision — not an archive.

Our Approach

A four-pillar architecture

Each pillar stands alone and delivers value on its own — together they turn raw data into governance and public engagement tools.

01

AI Query & Inference Engine

Ask questions in plain language; every answer cites its source.

02

Unified Analytics Dashboard

Multi-source datasets aggregated into one view of lake health.

03

Simulation & Planning

Test interventions virtually before committing to them physically.

04

3D Map Showcase

Fly over the lagoon in a browser or VR headset.

Solution 01

Custom AI Query & Inference Engine

One engine, two audiences — officials retrieving evidence, and visitors learning by asking.

AI chat interface answering environmental queries with cited sources
For officialsData retrieval & memory. Natural-language search across decades of journals, legal rulings and socio-economic surveys — with every answer citing its sources, so findings can be verified before they inform policy.
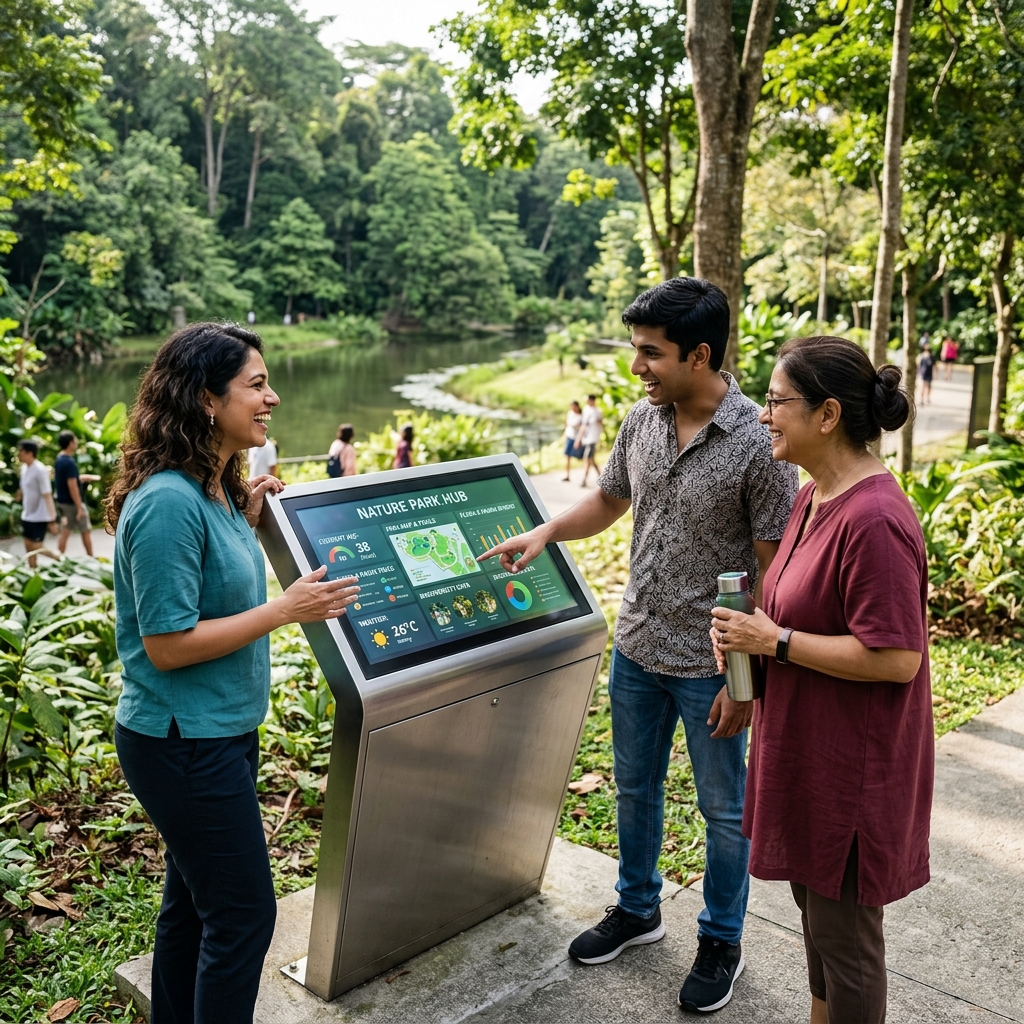
Visitors talking with an AI kiosk beside the lake
For visitorsTalk with the lake. On-site kiosks let tourists ask questions in their own language and learn about the ecosystem through conversation — by chat or by voice.
Prospective gain: democratises complex ecological data, shortens the research cycle behind policy decisions, and turns public curiosity into an educational asset.

Solution 02

Unified Analytics Dashboard

  • Aggregates terrain, vegetation, water quality (salinity, pH) and fish-landing statistics in real time.
  • Ingests and unifies multi-source datasets, including socio-economic data.
  • Generates public-facing charts and tables for the web.
  • Surfaces historical episodes — such as the community and biodiversity effects of reduced tourism during COVID-19.
Prospective gain: a holistic view of lake health, enabling swift response to algae blooms or illegal aquaculture expansion.
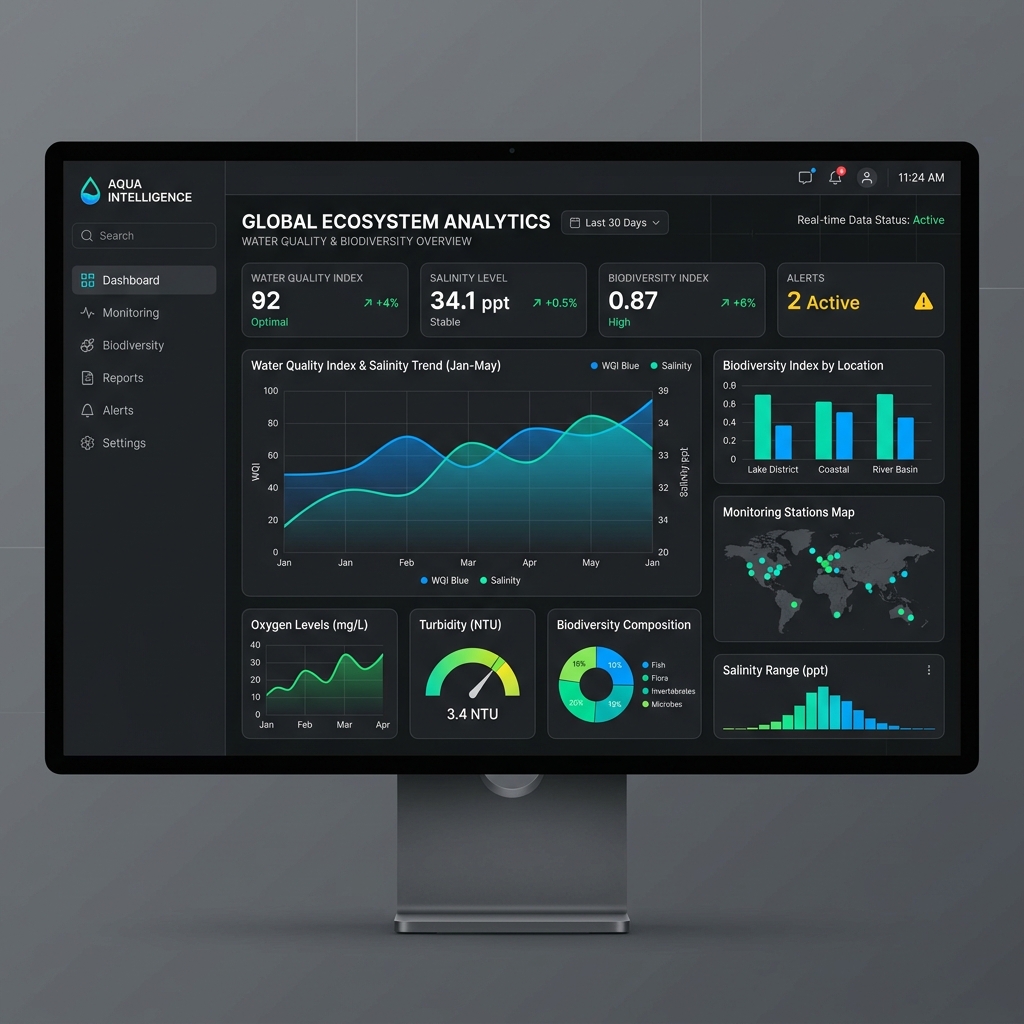
Environmental analytics dashboard showing water quality, biodiversity and landing statistics

Solution 03

AI-Powered Simulation & Planning

Test an intervention virtually before committing to it physically.

  • Worked example: using the September 2000 mouth opening at Satapada as a reference, simulate how further dredging would shift salinity gradients and dolphin migration.
  • Requires historical data on factors and their measured impacts to date.
  • Strengthened by reference cases where comparable factors were in play.
Prospective gain: mitigates irreversible ecological damage by letting stakeholders test hypotheses virtually first.

Solution 04

3D Map Showcase — Web, VR & AR

  • Terrain built from accurate contour and altitude data.
  • Vegetation and settlements layered in — programmatically or from drone footage.
  • Layers for salinity, sediment load, shoreline change, algae-bloom hotspots and habitat suitability.
  • Accessible in a browser, or through VR headsets at visitor centres.
Prospective gain: a significant boost to ecotourism, and a compelling instrument for securing international conservation funding.
Open the live map demo →
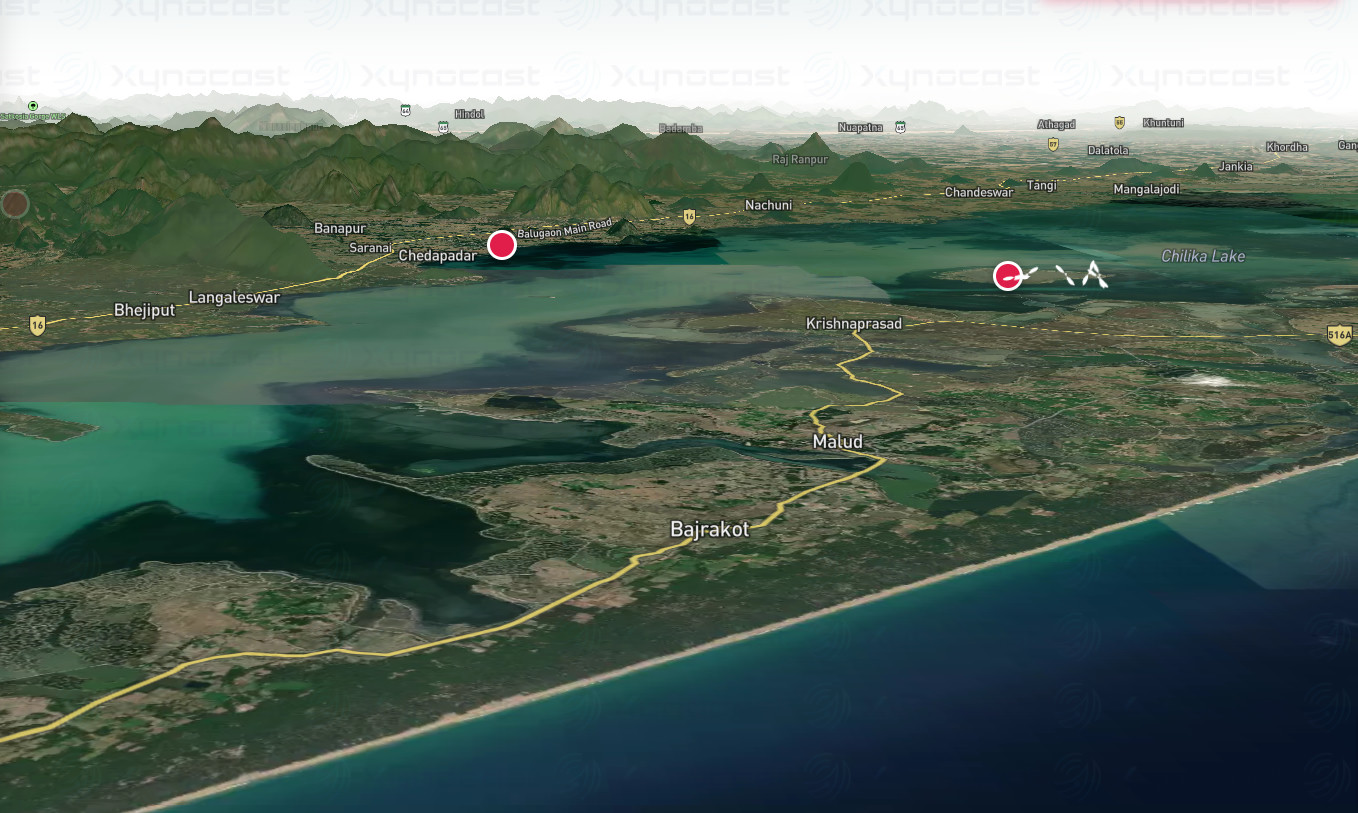
3D terrain view of Chilika Lake with the surrounding hills, barrier island and coastline
Live from the working demo — real terrain and altitude data.

Value & Next Steps

From fragmented management to proactive governance

1

Discussion & data assessment

A working session on data readiness, security requirements — self-hosted models versus cloud — and which solutions to prioritise.

2

Fast MVP

Rapid deployment of the 3D Map Showcase and a foundational Analytics Dashboard, for immediate value and a working demonstration.

3

Incremental rollout

Phased integration of the AI Query Engine and Simulation modules as data pipelines are solidified.

Note on model choice: given the governmental context, some LLM providers may be unsuitable. Self-hosting is fully supported and adds a one-time hardware cost, to be scoped in step 1.

Project Team

Your points of contact

Kashif
Kashif
Lead Technical Implementation
Core AI architecture, geospatial data integration and custom simulation development.

Ritesh
Ritesh
Client Communications & Strategy
Primary contact for project updates, strategic alignment and feedback.